Before we derive the standard deviation formula let us first understand the meaning of standard deviation. For a set of data, the measure of dispersion, about mean, when expressed as the positive square root of the variance, is called standard deviation. It measures the dispersion or spread of data.
The formula for calculating the standard deviation of given data is:
σ = Population standard deviation
N = Number of observations in the population
Xi = ith observation in the population
μ = Population mean
Standard Deviation For Discrete Data
For discrete frequency distribution of the type:

The standard deviation is given as:

where x̄ is the mean of the distribution and

Standard Deviation For Continuous Frequency Distribution
For continuous frequency distribution, the mid-point of each class is considered for calculating the standard deviation. If the frequency distribution of n classes is defined by its mid-point xi with frequency fi, the standard deviation is given by:

where xi represents midpoints of the classes and fi represents the respective frequencies.
And x̄ is the mean of the distribution and

Derivation
Now let us try to obtain another standard deviation formula:

Or,

This gives us the standard deviation (σ) as:

This is the standard deviation formula for a given set of observations. But sometimes, it happens that the value xi in a given data set or the midpoints of classes in a given frequency distribution is very enormous. In such cases, the determination of mean or median or variance becomes lengthy and time-consuming. To solve this problem, we make use of the step deviation method to simplify the procedure.
Simple Method to Find Standard Deviation
Let us discuss this shortcut method for determining variance and standard deviation.
Consider the assumed mean as ‘A’ and the width of the class interval to be h. Let the step deviation be yi.

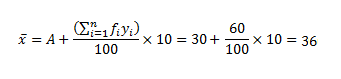
The mean of a data set is given by:

Substituting the values of xi from equation (1) into equation (2), we get

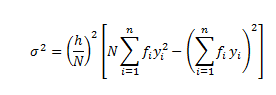
Variance of the variable x,

Substituting the values from equation (1) and (3), we have

σx=h2 × variance of variable yi
⇒σx2=h2σy2
⇒σx=hσy—(4)
From equation (3) and (4), we can conclude that:

Solved Examples
Let us look into an example for a better insight.
Example 1: Find out the mean, variance and standard deviation for the following data representing the age group of employees working in XYZ Company.
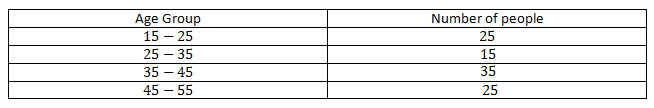
Solution: Let the assumed mean A = 30 and h = 10. From the table given above, we can obtain.

Thus,
The variance of the above data can be calculated as:
= (10/100)2 [100 × 160 – (60)2] = (1/100) [16000 – 3600] = (100/100) [160 – 36] = 124
The standard deviation can be given as:
σ = √124 = 11.136
Example 2: Find the mean, standard deviation and variance for the following data:
57, 64, 43, 67, 49, 59, 44, 47, 61, 59
Solution:
Given,
57, 64, 43, 67, 49, 59, 44, 47, 61, 59
Number of data values = 10
Mean(�―)= (57 + 64 + 43 + 67 + 49 + 59 + 61 + 59 + 44 + 47)/10
= 550/10
= 55
Standard variance (σ)
RELATED POSTS
View all